OBJECTIVE
To inform our clients and prospective investors on the basic methodology used in our advanced technical analysis and thereby reveal the overall methodology and performance of the MASTERStockAnalysis program.
BACKGROUND
The MASTERStockAnalysis is based on a proprietary logic discovered at ATC after many years of intensive research work on technical analysis of stocks. The program optimizes 8 to 10 key parameters to provide the best performance (gain and/or reward-to-risk ratio) during its operation. Re-optimization is done in a period of about 30 days to be used for the next period. Independent optimization and re-optimization is performed for the short logic at the end of each period.
METHODOLOGY
Any stock analysis and recommendation program must deal with two issues. First, to provide the buy/sell timing points, and second, to suggest a buy/sell price when a trade timing is triggered. MASTERStockAnalysis program has these two critical components and uses both statistical and pattern recognition algorithms to achieve them. However, there is one newly-discovered and proprietary core buy/sell decision making logic which is responsible for more than 80% of the buy/sell signal points. To the best of the author's knowledge, there is no place in the open literature where this proprietary logic is discussed or even mentioned. Therefore, the author confidently claims this to be an original contribution. The novelty of it to the readers or users, of course, can be truly proven only by monitoring its performance for a sufficiently long period of time (2 to 3 months) or a number of trades (5 to 7). There are many (over 80 or so) technical analysis approaches and indicators in open literature to guide the buy/sell timing points. Out of these only a few has been shown to provide statistically significant performance than the passive "buy-and-hold" strategy over the years, see Colby and Meyers[1]. By far the most comprehensive published work this author is aware of is the systematic work done by Colby and Meyers. Rigorous testing of the MASTERStockAnalysis program includes many of the methodologies discussed in this book. However, as will be seen, the time scale for the application of the MASTERStockAnalysis is tailored to be shorter than those discussed by Colby and Meyers. It should be mentioned that the MASTERStockAnalysis program is not designed for day-traders although such a potential exists and can be incorporated.
Almost all well-performed programs must optimize their parameters using the past historical data. This by itself should be optimized. That is, one must find the best historical data period for the optimization process to provide the highest performance. Although some variations exists, it appears that a 6-month period is the best for the MASTERStockAnalysis program in most cases. The optimization efforts themselves are controversial. Critics point out that future market behaviors and price patterns may not follow those on the past. Proponents respond that there is sufficient similarity to make the optimization worthwhile. The correct method to test technical decision rules is blind simulation or ex-ante cross validation. Optimized rules should be accurately defined on past historical data, then tested on more recent data not included in the prior optimization search. Only this way, one can gain a realistic perspective on how it would be to project past-optimized rules forward through time, just like in real time. According to Colby and Meyers, this testing process imposes the rigor of the scientific method on technical analysis theories. Many studies suggest that the optimized timing decision rules can show reasonably worthwhile results when projected forward through real-time simulation. However, one should keep in mind that because the future is always somewhat different from the past, it is unwise to expect future results to be as perfect as past optimized performance. Nevertheless, experts believe that optimization profitability testing offers a reasonable approach to selecting effective decision rules and practical investment strategy.
As indicated, optimization process for the MASTERStockAnalysis program uses 6 months of daily historical data for analysis purposes. One can think of the optimization process as a psychologist or a therapist accompanying someone on a daily basis for a period of 6 months during which the analyst observes and analyzes his/her behavior. Then after the end of this period a good therapist would be in a well-informed position to predict the person's response to life events with higher averaged likelihood of success than anyone else. For the MASTERStockAnalysis program, once determined, the optimized parameters are held constant for the next two to four weeks after each optimization event depending on the market and stock performance. In principle, given a high speed computer, the optimization can be done on a daily basis. However, such a short time activity would be quite unnecessary. Results on application of the MASTERStockAnalysis for a selected stock (AOL) will be shown next as an example. The AOL stock was purposely chosen because of its poor performance in the past year. In this case, a six-month period of the past historical daily data from Nov, 9, 1998 was the starting point. The MASTERStockAnalysis was optimized for this period and then applied for the buy/sell decisions during the following month. Of course in this case the next month's actual daily price data is available and can be tested. This process continued with monthly re-optimization for one year and the results were compared with several strategies including the "buy-and-hold" approach. Figure 1 shows the buy/sell pattern exercised by the MASTERStockAnalysis program for the AOL's stock for a period of one year.
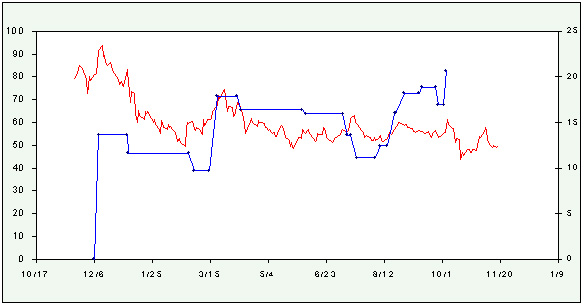
The red curve shows daily historical close price data and the blue indicates the buy/sell points. Horizontal segments of a line indicate periods when program stayed out of the market (cash position). The scale for the blue curve is on the right edge with the unit of $/share and is 1/4 of that shown at the left edge of the plot which is for the daily close price values. The horizontal axis shows the time scale. At the end of the one year examination period the gain achieved by the MASTERStockAnalysis program was 20.68 $/share whereas a posteriori optimization of this one year actual simulated period gave 47.25 $/share. A posteriori optimization refers to a situation where the future historical data is somehow (God-ly) known for one year and one uses the MASTERStockAnalysis program to achieve the best performance possible. This is the maximum gain the program would have delivered, if it had a crystal ball and knew the future. It is important to note, and it should be obvious, that in actual application the monthly optimization simulation test does not see and know anything about the future and therefore must consistently (on monthly bases in this test) re-optimize as time progresses. This is necessary in order to include the new data in each optimization event. For this one-year test period, the passive buy-and-hold produced -20.43 $/share loss assuming that the buy and the sell events corresponded to the program's first buy and the last sell points, respectively. For the "buy-same/sell-max strategy," in which the buy is assumed to be the same as the program's first buy but the sell point be whenever the absolute maximum of the daily price occurs, a 14.7 $/share gain is possible. The "buy-min/sell-max strategy," being realistic only if the maximum price occurs after the minimum in time, is 50.44 $/share. However, this strategy cannot be applied to AOL as the minimum price occurs after the maximum in time. For those stocks that this strategy is a possibility, results are always considered and compared with that of the MASTERStockAnalysis program. Finally, if one visually inspects the same one-year daily historical data and selects the best buy and sell points, then an absolute "ideal or theoretical gain" of about 74.8 $/sharecan be calculated. Obviously in real application such a future information is not available and this exercise is merely for determination of the theoretical maximum gain for this one-year period irrespective of the choice of the technical analysis program. To be correct, this theoretical maximum gain of 74.8 $/share should be compared with the 47.25 $/share when the MASTERStockAnalysis program somehow (God-ly) knows the future.
It is important to indicate that in many cases it is not desirable to optimize the gain, rather it is best to work with the so-called reward/risk ratio or both. Reward/risk ratio is defined as the "total gain for each 6-month optimization period" divided by "the maximum single-trade loss" for the same period. Other definitions of this ratio such as "maximum single-trade gain" divided by "the maximum single-trade loss" or "total gain" divided by the "total loss" for each optimization period are also used to reach to the final optimization parameters at each stage. During each optimization exercise both of these performance parameters (i.e. gain and reward/risk ratio) along with the percentage of the positive-gain trades are closely monitored for determination of the optimum program parameters to be considered for the next two to four week trading activities. It is worthwhile to point out that the stock market is a highly nonlinear system with degrees of randomness and fractal behavior and often has multiple solutions. Many optimization routines have difficulties finding the true optimized parameters (based on the gain, reward/risk and % positive-gain trades performance criteria discussed above) for the MASTERStockAnalysis program. The author has developed a methodology to unequivocally identify the optimized points.
The short/cover-short logic of the program also goes through a similar rigorous back testing and optimization procedure prior to its actual application.
It must be emphasized here again that the MASTERStockAnalysis program is not currently designed for day-trading activities. A typical scenario for its operation is as follows. Every evening after the market is closed, the user initiates an access to the YAHOO site to download daily historical data of the desired stocks for a period of six months which includes today's trading information. The user must ensure that today's price information is indeed included in each file. Each file is then imported into the program. Then the MASTERStockAnalysis program issues either a buy (a jump down for a long and a jump up for the short strategies, see the Brief Instruction section below), a sell (a jump up for the long and a jump down for the short), or a hold ( no jump) signal. If a buy or sell is initiated, then the program suggests the best price to be used in the online broker software for the next day. This price is also optimized so that, first, it is highly likely to be materialized (i.e. be in between the LO and HI prices of the next day) and, second, be the best value for the type of the trade recommended (i.e. be closer to the LO if buying and to HI if selling). For those situations where the suggested price can not be materialized, the only remedy is through user's midday inspection of the price activity the next day. Note that the idea and the reason behind this approach is to avoid user's continuous and full-time inspection of the market as is often done by day-traders. One can have other dedicated professional activities during the day and combine it with a minimal stock market effort time in the evening using the MASTERStockAnalysis for optimum performance. However, there are cases where higher gain is achieved if one can determine the buy/sell timing before the market is closed rather than discovering it in the evening after the historical data is downloaded. This desired feature is available in the MASTERStockAnalysis program. Every day the user should visit the online market for collection of the "midday" stock activity information. It is then manually imported to the program for sensitivity analysis. If indeed a buy/sell signal is recommended, the user should act before the market is closed. Although better performance can be achieved in this manner, it requires one midday visit of the market price activities for the stocks of interest.
It is clear that the proprietary decision rule in the MASTERStockAnalysis program when optimized monthly using the past 6-month historical daily data provided a robust and superb performance considering that the AOL stock in this one-year period performed very poorly.
It is hoped that by the aforementioned explanation of the methodology and sample results we have addressed some of the questions our clients have posed to us.
[1] Colby, R. W, Meyers, T. A, The Encyclopedia of Technical Market Indicators, McGraw-Hill, 1988.
BRIEF INSTRUCTION FOR THE "MASTERStockAnalysis" program
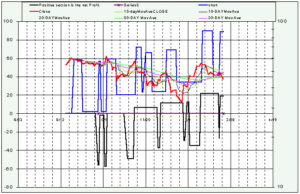
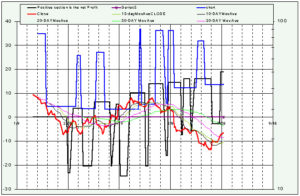
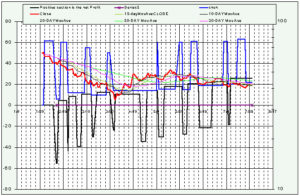
The thick black square-curve indicator shows the buy/sell timing. A sharp drop or jump down on this curve indicates a buy signal. The size of the jump is equal to the suggested buy price. A sharp rise or a jump up is a sell signal. Likewise, its size is the suggested sell price. The cumulative gain after each buy/sell cycle is the amount that this black indicator is above the zero level. The scale for the buy/sell indicator curve is shown at the left edge of the plot. Note that the scale for the stock price may be logarithmic and shown at the right edge of the plot. Therefore, care should be exercised by the users in interpreting and comparing the gain/loss shown for each trade cycle with that measured on the price curve. The period between each vertical scale lines (dashed or solid) is 4 days. It is important to emphasize that even though moving averages are shown in the plots the core of the decision makings (nearly 80%), which is proprietary, is NOT based on the simplistic and classical approach of using moving average cross-over rules.
The thick blue indicator shows the short (jump up) and cover-short (jump down) points. The cumulative gain after each short/cover-short cycle is the lower part of this thick blue indicator.
CUSTOMER INFORMATION
Visitors interested in this technology can sign a contract to receive emails at the buy/sell and/or short/cover-short timings along with the optimized suggested buy/sell prices for a nominal fee. Also, a client version of the program can be purchased to be used in conjunction with our monthly-updated optimized parameters as inputs for a fee. Please contact Advanced Technology Consultants for more details.
LAST UPDATED: 04/30/16
- Note that the scale for the stock price may be logarithmic and shown at the right edge of the plot. Therefore, care should be exercised in interpreting and comparing the gain/loss shown for each trade cycle with that measured on the price curve.
- The total $ gained should be calculated as the sum of the gains for the long and short strategies. Note that there are occasions that the short strategy delivers a better performance than the long strategy and vice versa. Exercising both strategies increases the total $ gain in almost all cases.
- Note, it is critical to recognize that after three to four weeks from the last optimization date (given for each stock below) the performance is not expected to stay as high as before and a re-optimization is to be performed.
- As indicated in the above, higher gain than shown below is achievable if one can determine the buy/sell short/cover-short timings before market is closed rather than discovering it in the evening after the historical data is downloaded. This feature is available but not used for the trade decisions of the selected stocks given below.
- Following results are not updated daily and shown here solely for comparison and program performance purposes.
AOL:
LAST POSTED OPTIMIZATION UPDATE:
NOK:
LAST POSTED OPTIMIZATION UPDATE:
QQQ
LAST POSTED OPTIMIZATION UPDATE:
TECHNICAL ANALYSIS WEBSITES:
- QickenChart
- Alphachart
- Trend Analysis
- FreeRealTime
- Interpreting Technical Indicators
- Technical Analysis from A to Z
- StockMaster
- Society of Technical Analysts
- Australian Technical Analysts Association
- The Canadian Society of Technical Analysts
- Large Block Ratio - Technical Analysis from A to Z
- Technical Analysis
- Technical Analysis Control Center
- Technical Analysis Solutions - TraderMade
- Advanced neural network based stock technical analysis, prediction, rank
- Home of Stock Technical Analysis
- Technical Analysis of Stock Magazine
READ HOW QUANTITATIVE INVESTORS USE THEIR MATHEMATICAL SKILLS